State of the Interactive Product Demo 2024
This is our second year running this report, with the goal of answering the most common questions we heard from customers and prospects over the last year. We looked at the top 1% to understand what top performing demos had in common.
Why did we make this report?
About this report:
Over the past three years, there has been increased growth and interest in interactive demo space. In particular around interactive demo best practices and benchmarks.
This is our second year running this report, to answer the most common questions we heard from customers and prospects over the last year.
With more than 18,000 interactive demos built on our platform (a 6x increase from last year) - we looked at the top 1% to understand what top-performing interactive demos had in common.
In this report we review:
- What makes top interactive demos stand out
- How interactive demos compare to other common marketing channels
- What are the most popular use cases for interactive demos
- How to build an engaging interactive demo
- What are the most common ways to promote a website interactive demo
Data overview:
- Almost all of the companies analyzed were SaaS (software as a service) companies.
- A majority of the data points are for the top 1% of our customer interactive demos
- Top 1% and 25% were determined by our customer interactive demos with the highest traffic and click-through rates.
- Data collection was a combination of customer data analysis and manually reviewing customer interactive demos.
- We used our internal data to calculate engagement, completion, and click-through rates.
- We manually reviewed interactive demos in the top 1% for data points such as use case, content, and promotion.
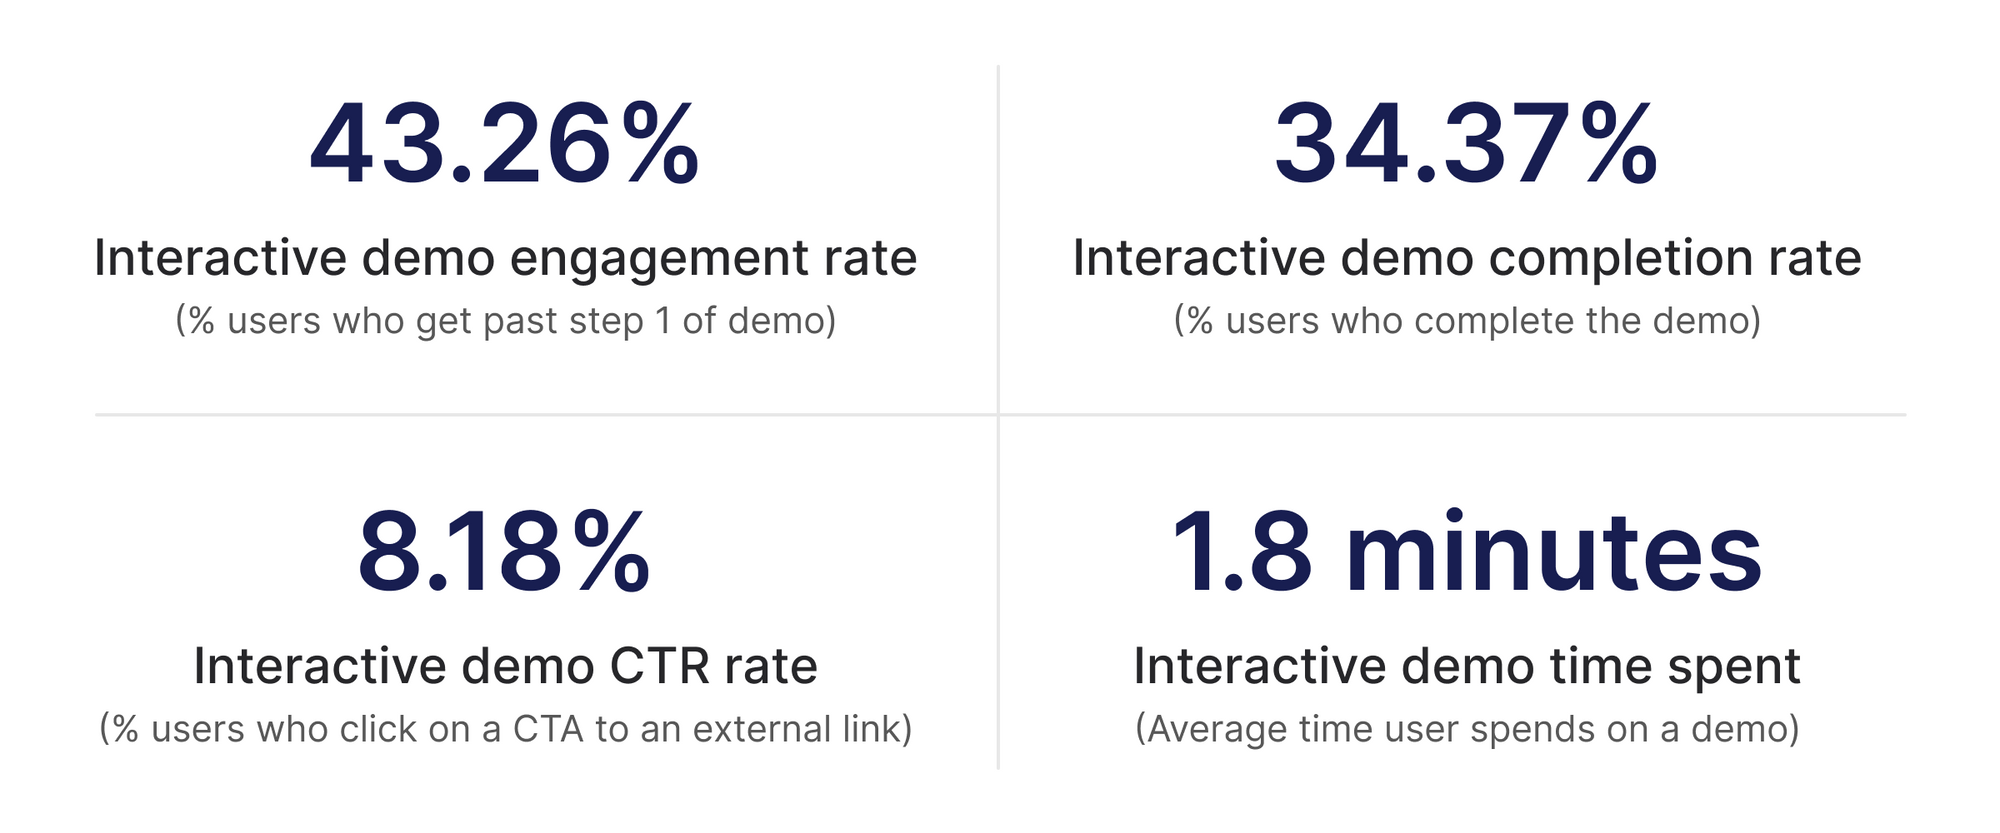
What are interactive demo benchmarks?
Below is a high-level overview of some of the most requested benchmark metrics around interactive demos. A breakdown of each of these stats for different demo use cases can be found below.
Metric definitions:
- Engagement rate: Total number of sessions with a completed step one / total number of sessions
- Completion rate: Total number of completed demo sessions / total number of started demo sessions
- Click-through rate: Total number of CTA clicks to an external link / total number of demo sessions
- Demo length: Average time a user spends on a demo
Top 1% of interactive demo metrics
Metrics for the top 1% of our customer interactive demos were determined by traffic and click-through rate.

Top 25% of interactive demo metrics
Metrics for the top 25% of our customer interactive demos were determined by traffic and click-through rate.
How are top interactive demos different?
As seen above, the top 1% of interactive demos have a 1.4x higher engagement rate and a 3.9x click-through rate than the top 25% of interactive demos.
Throughout this report, we’ll go over what the top 1% of interactive demos do differently in demo setup and promotion. Some highlights include:
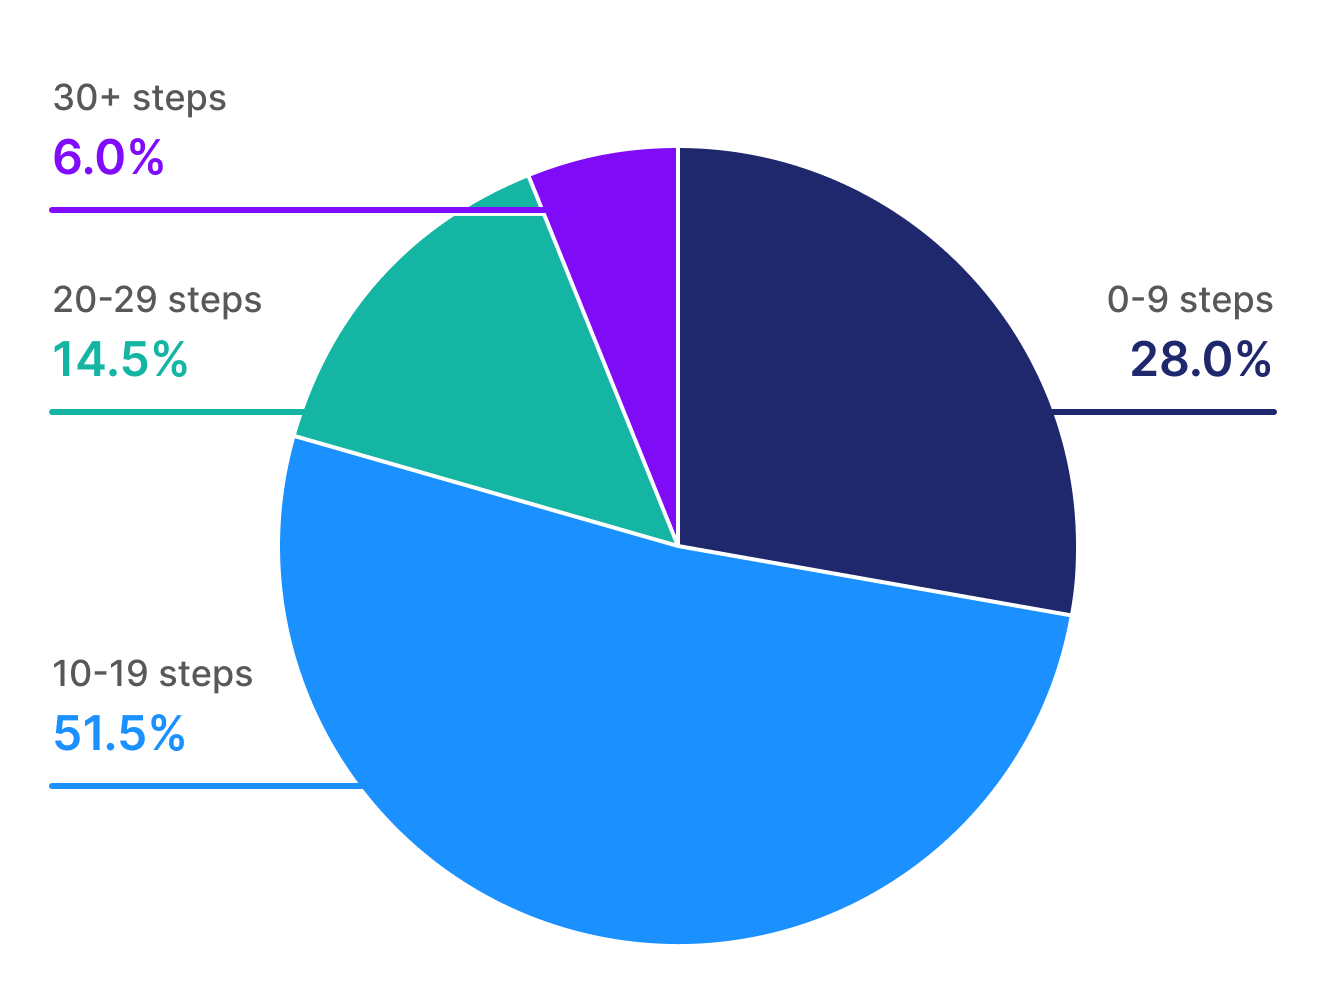
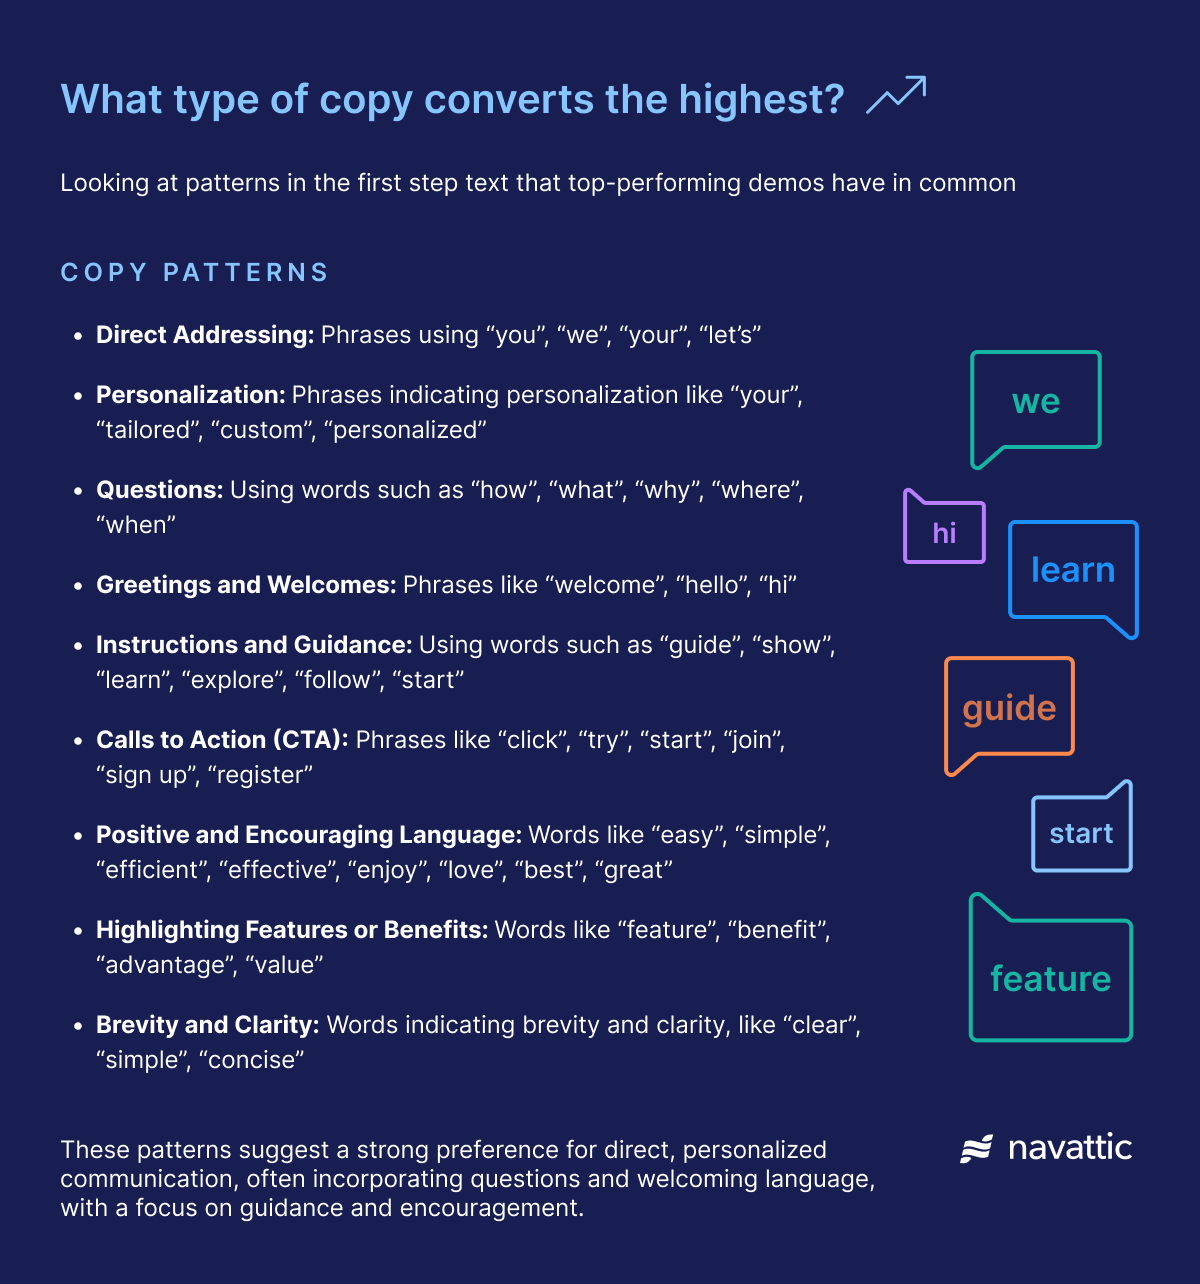
Content: Tells a concise, inviting, and personalized story vs general features
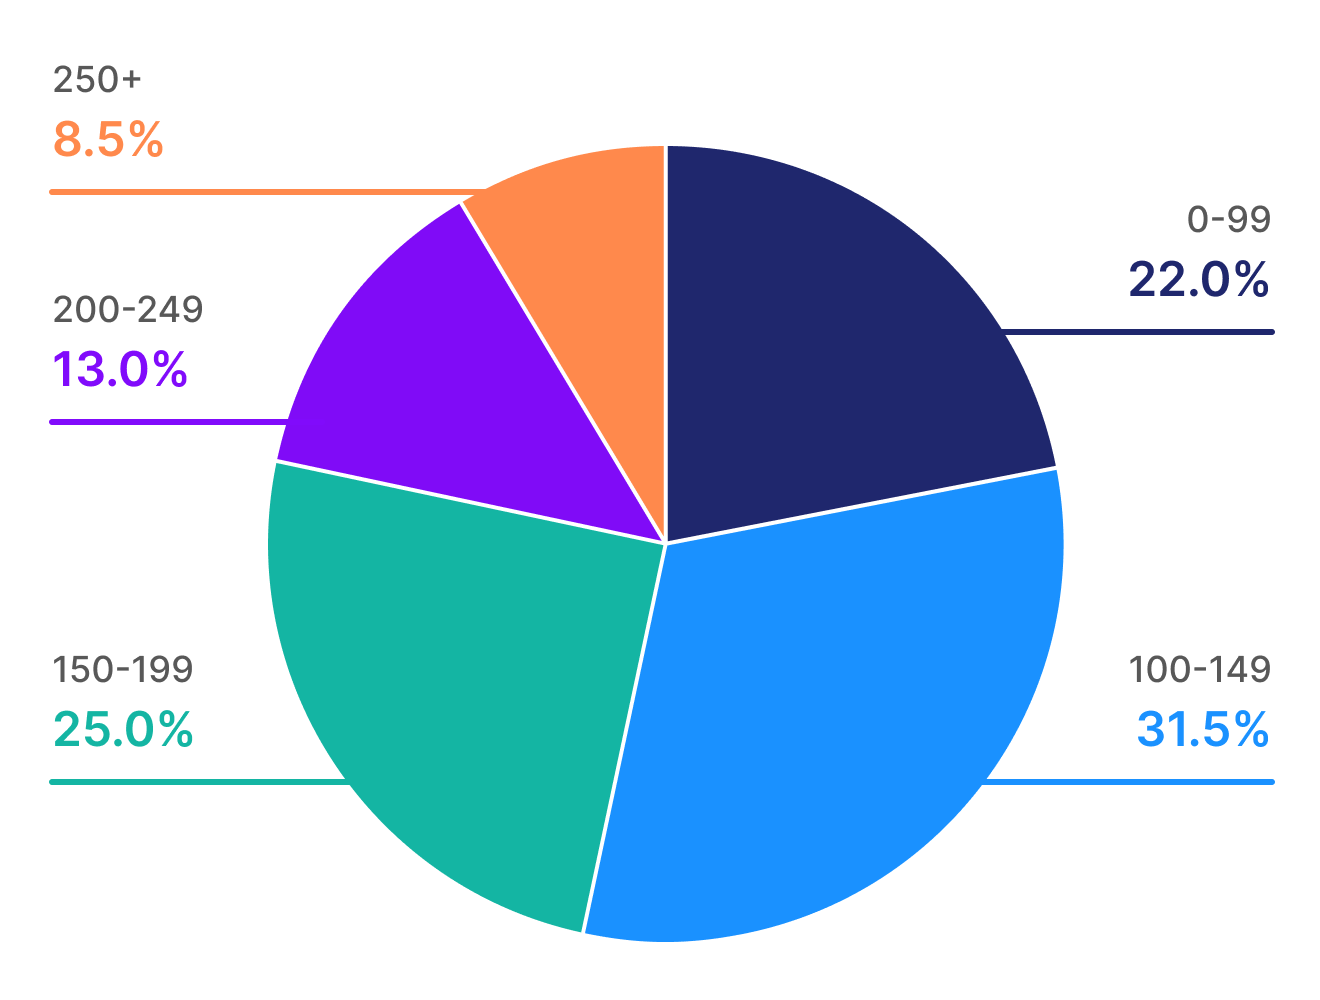
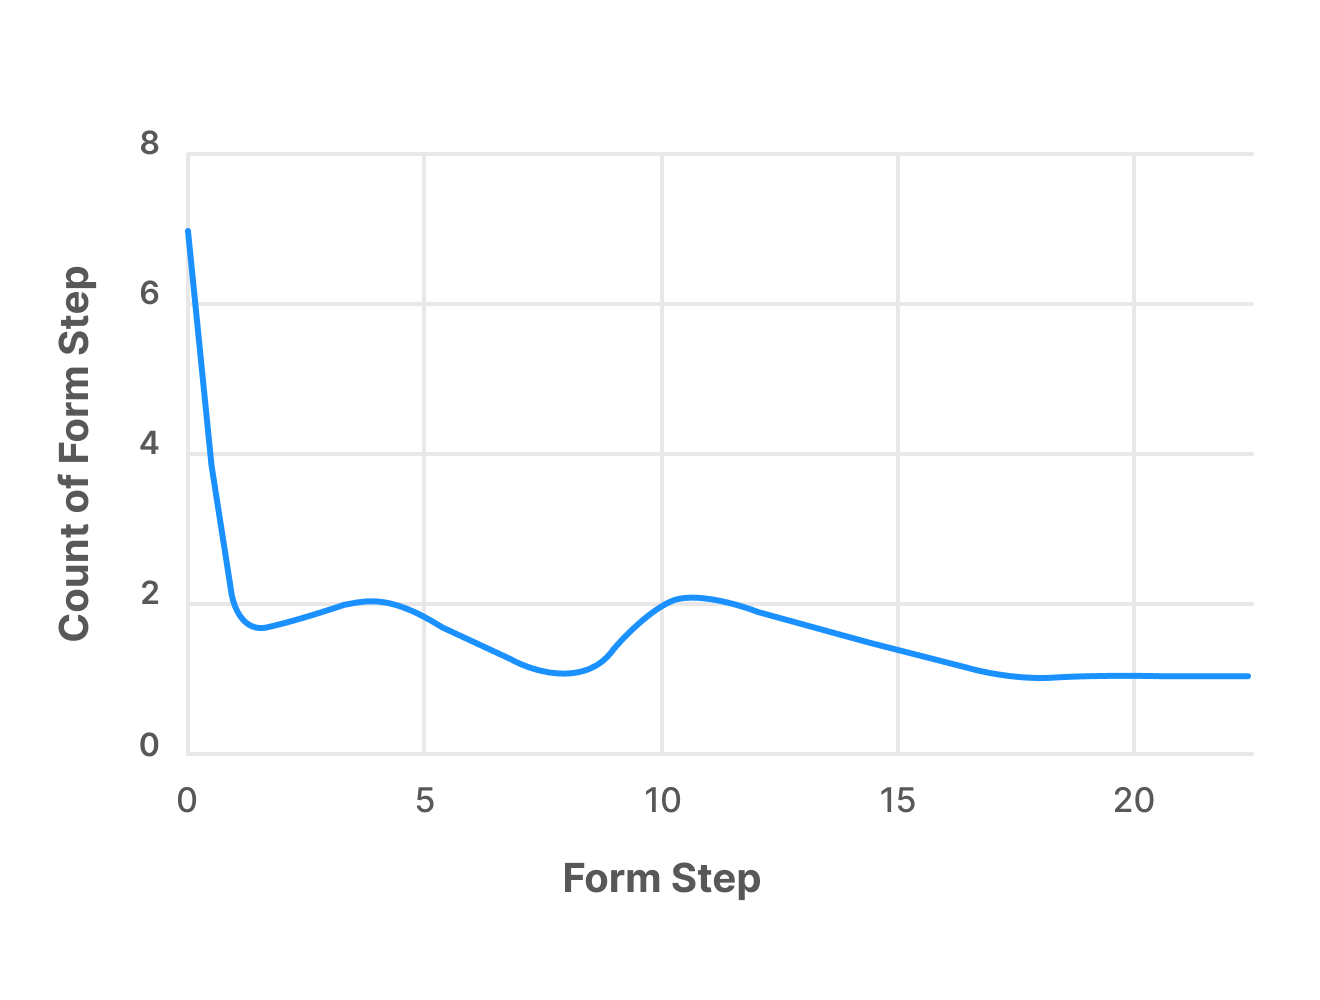
- Concise: ~ 15 steps and each dialog box is around 25 - 30 words
- Inviting: Uses words like “easy”, “simple”, “love”
- Personal: Uses words like “you”, “welcome”, “custom”
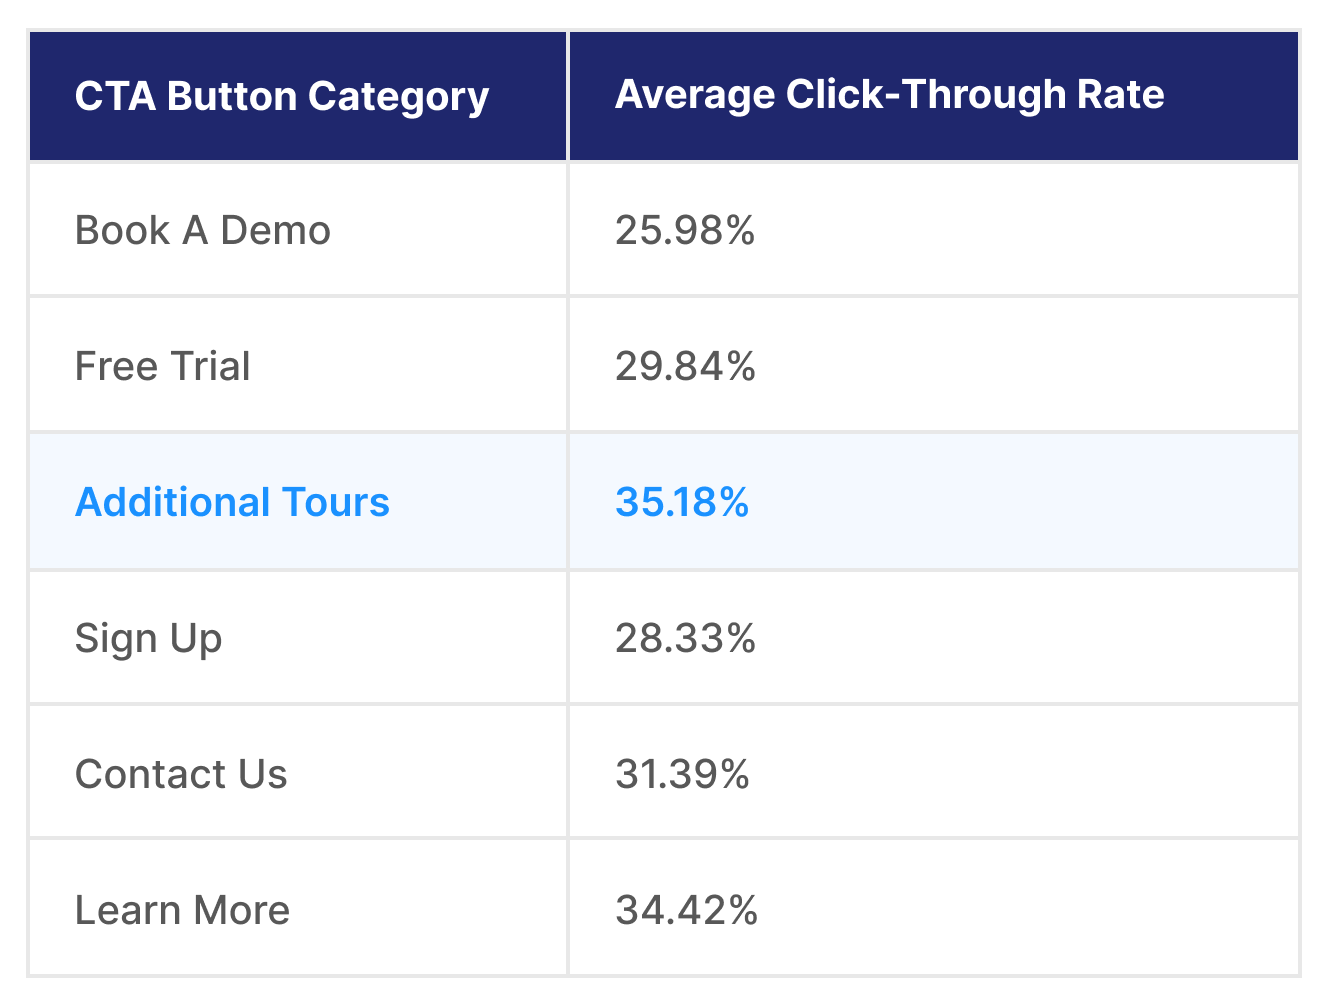
CTAs: Includes multiple internal CTAs to "Book a Demo", "Free Trial", or "Additional Tours"
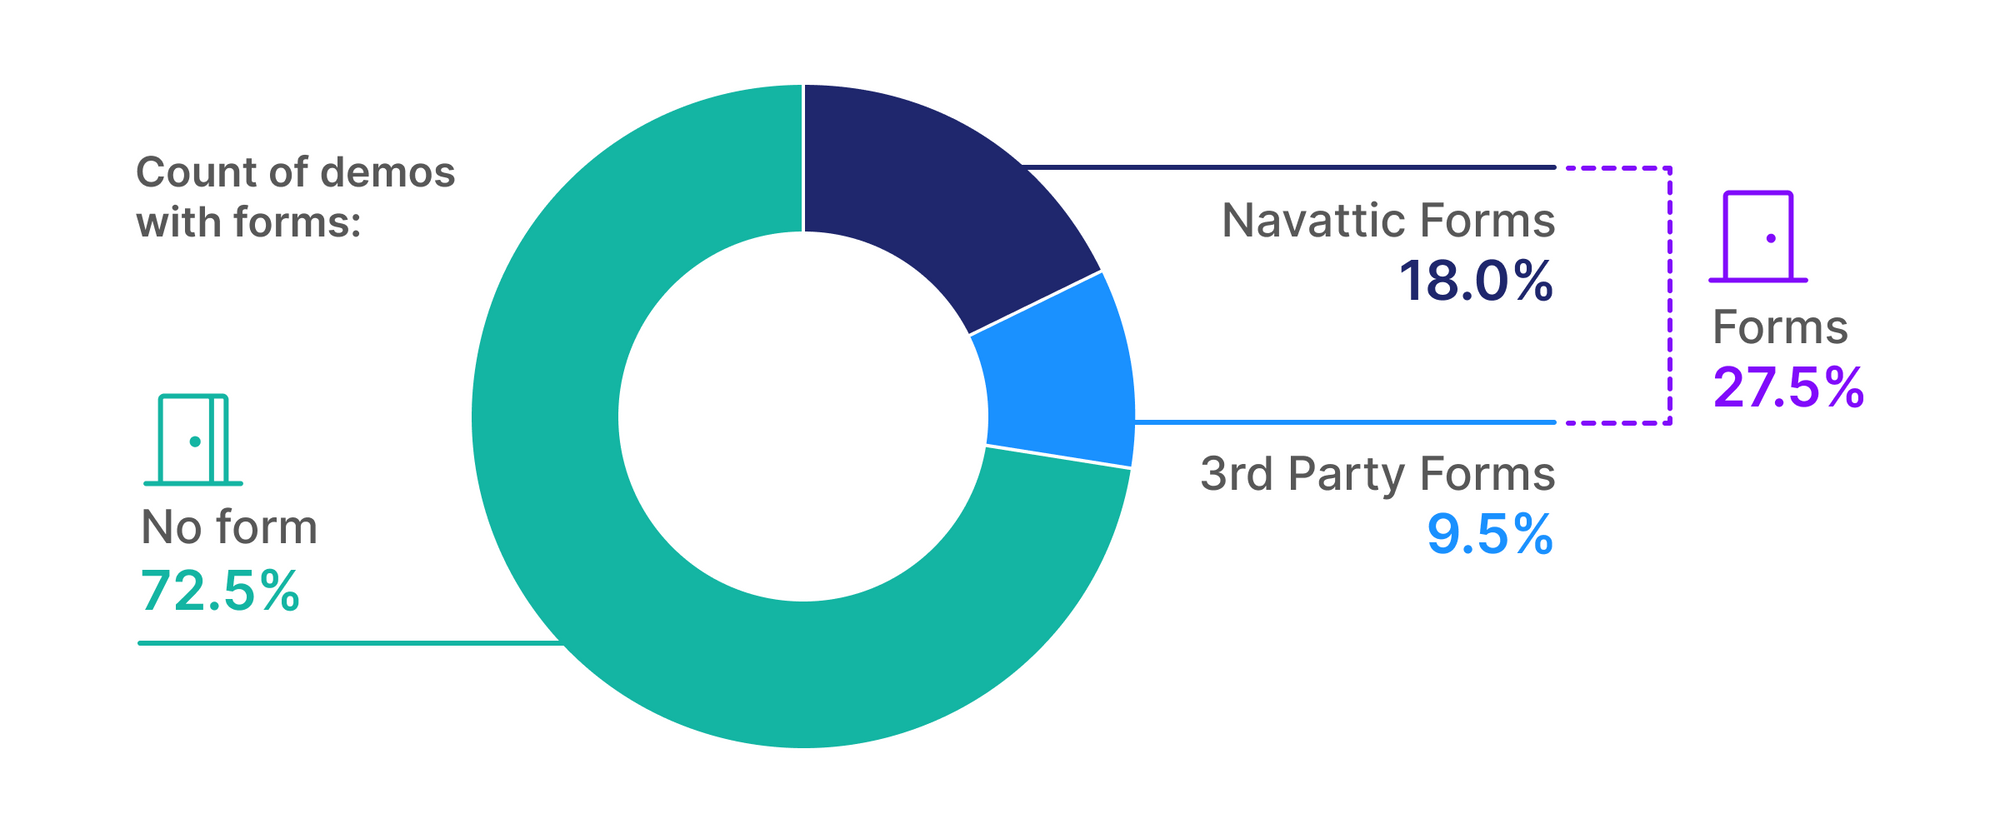
Forms: 73% of the top interactive demos were ungated
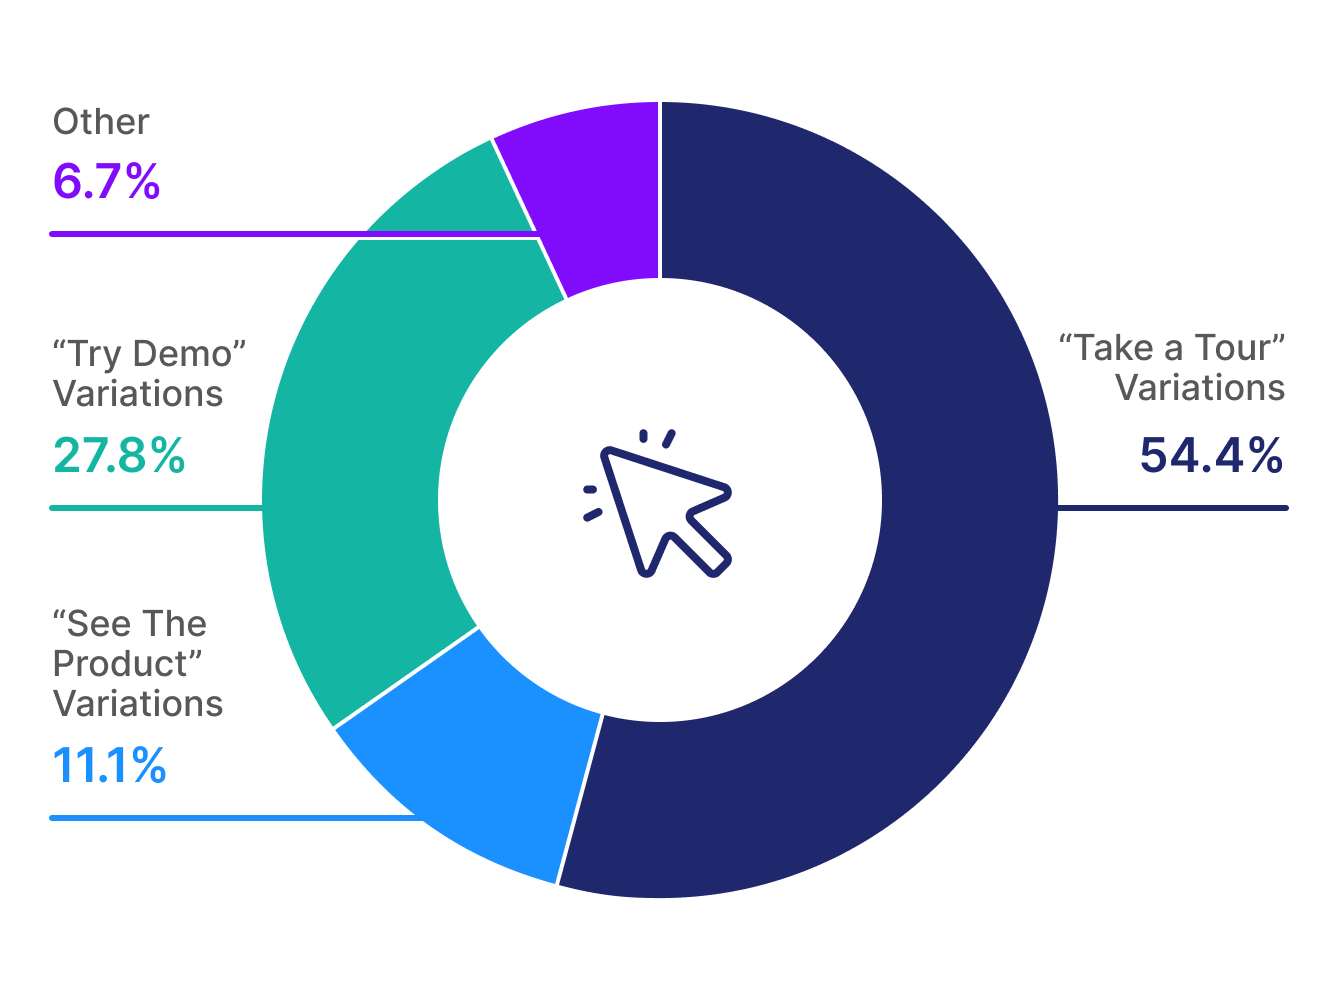
Promotion: 81% link to a full-screen demo via a “Take a Tour” CTA on the website. 84% of CTAs are above the fold or in the navbar
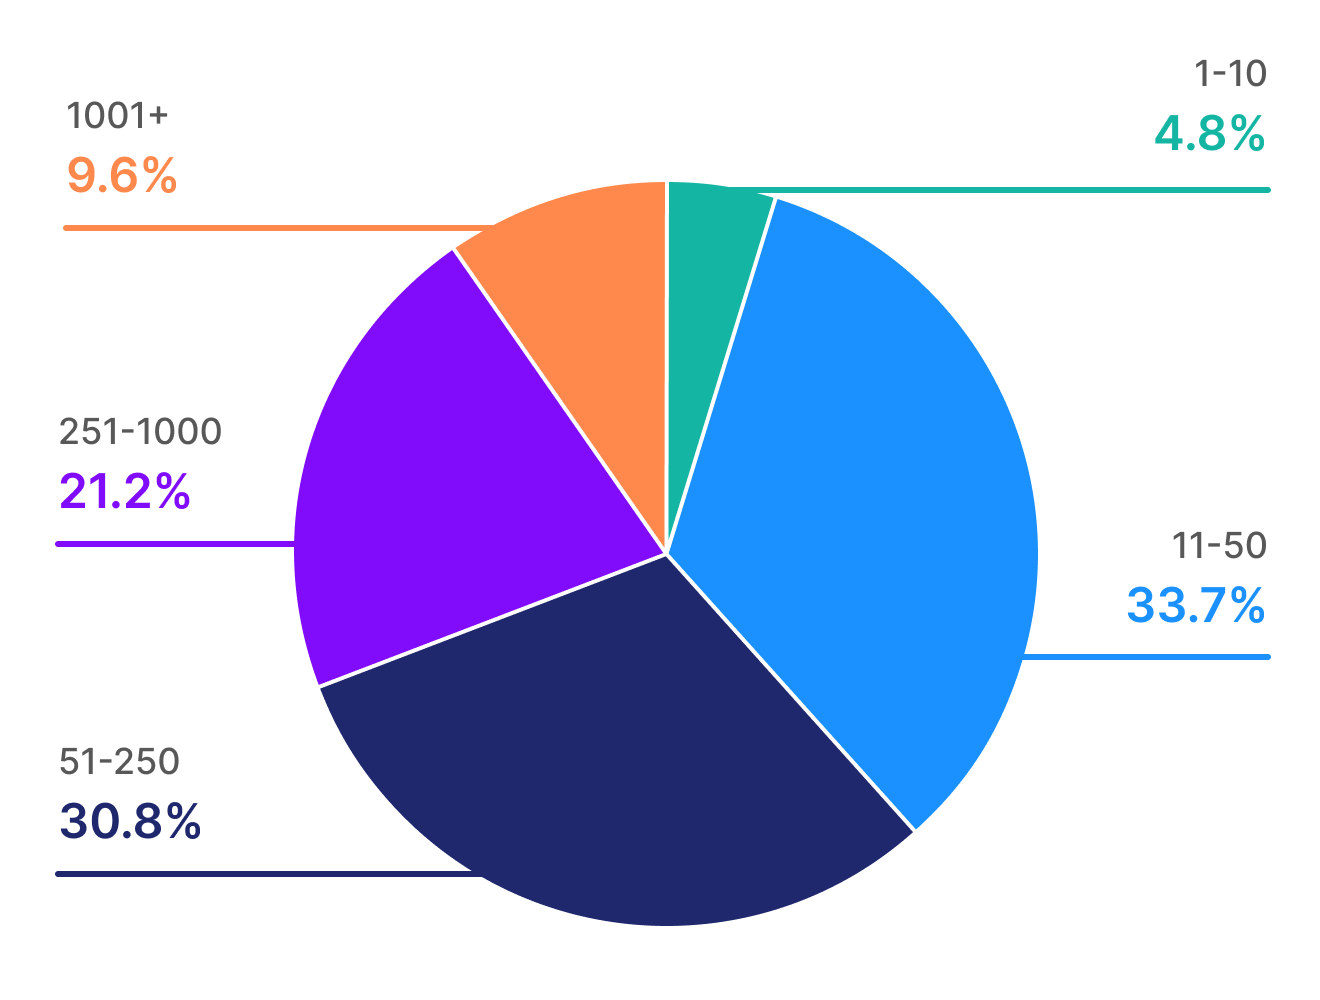
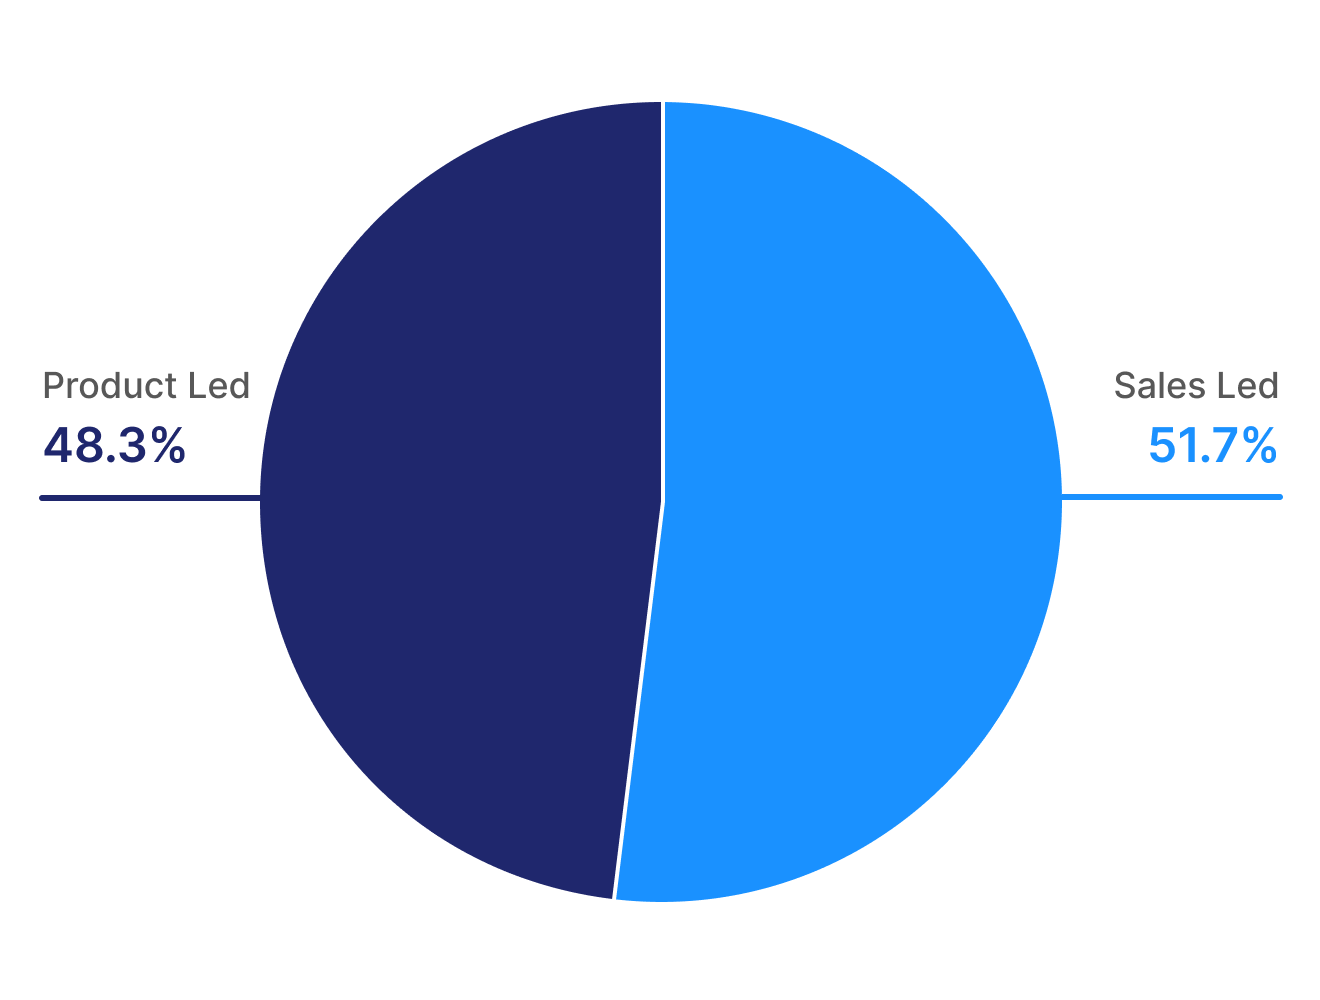
Who uses interactive demos?
For our top-performing interactive demos, we analyzed what demographic information they have in common, such as company size, industry, and if they are PLG or Sales Led. If you're looking for demo examples, check out our interactive demo showcase.
What are the demographics of these companies?

Why should I use interactive demos?
Before diving into how to make your demo successful, we wanted to answer why you should consider using one in the first place.
If you're not already using interactive product demo software, below are stats on how widely used interactive demos are and how they compare to other marketing channels like videos or ads.
How popular are interactive demos today?
Demo popularity was measured by a sample size of ~5000 B2B SaaS websites to see how many included an interactive demo and overall adoption from our customers.

How do interactive demos compare to videos?
We often get asked about the advantages of an interactive demo vs a video. For this section, we compared the average click-through rates of interactive demos to videos.

How do interactive demos CTR compare to other B2B channels?
We evaluated how typical interactive demo CTA CTR within an interactive demo compares to other B2B marketing channels such as email or paid ads.

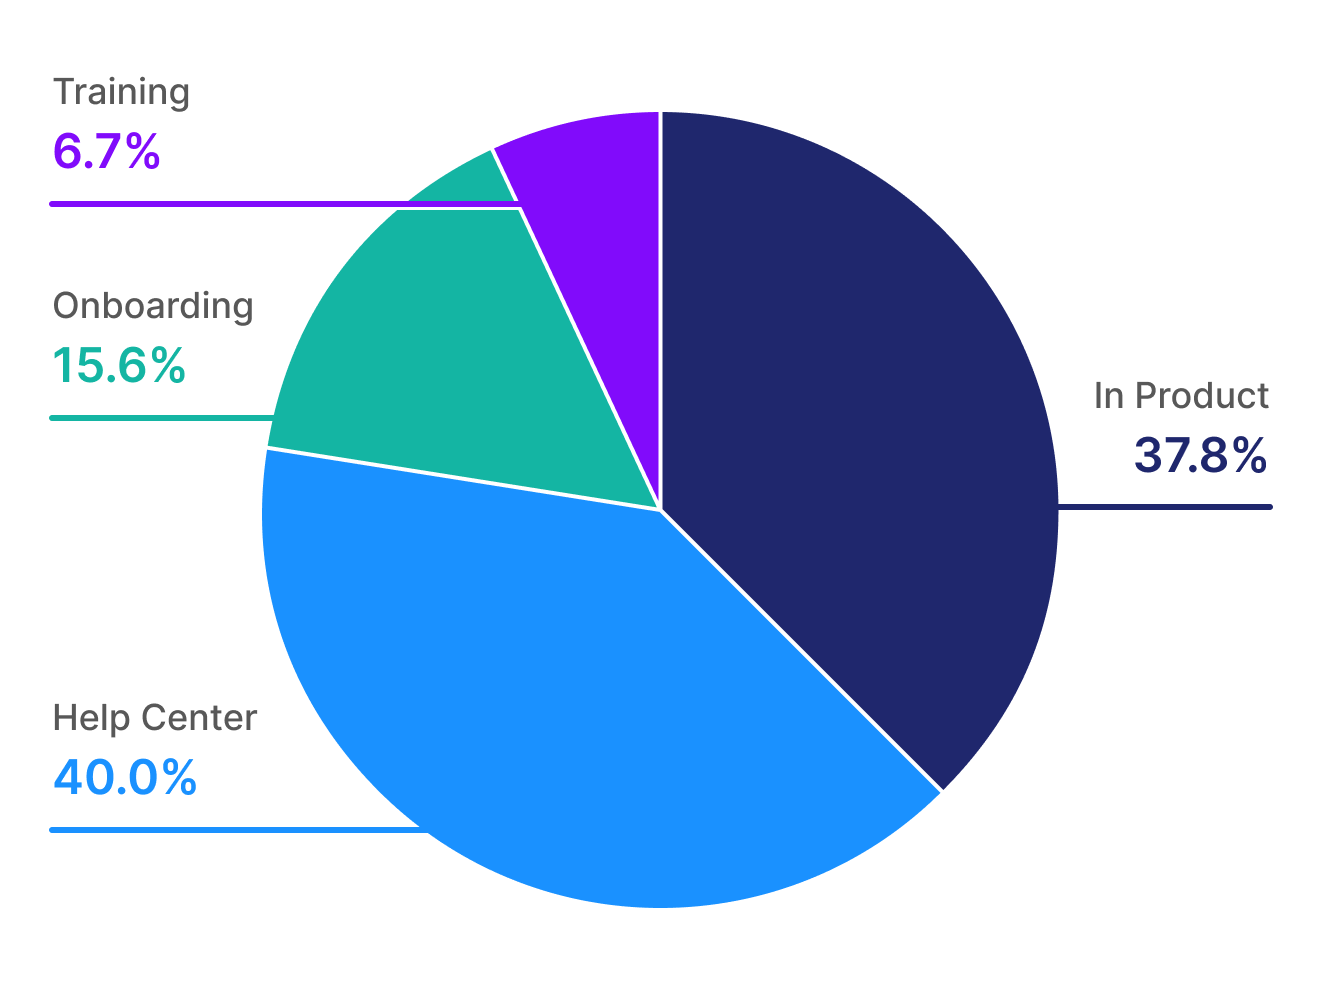
How can I use interactive demos?
While the website use case is our most common use case, this year we noticed an increase in customers using interactive demos across their GTM funnel - in marketing, within their product or help guides, and in their sales cycle.

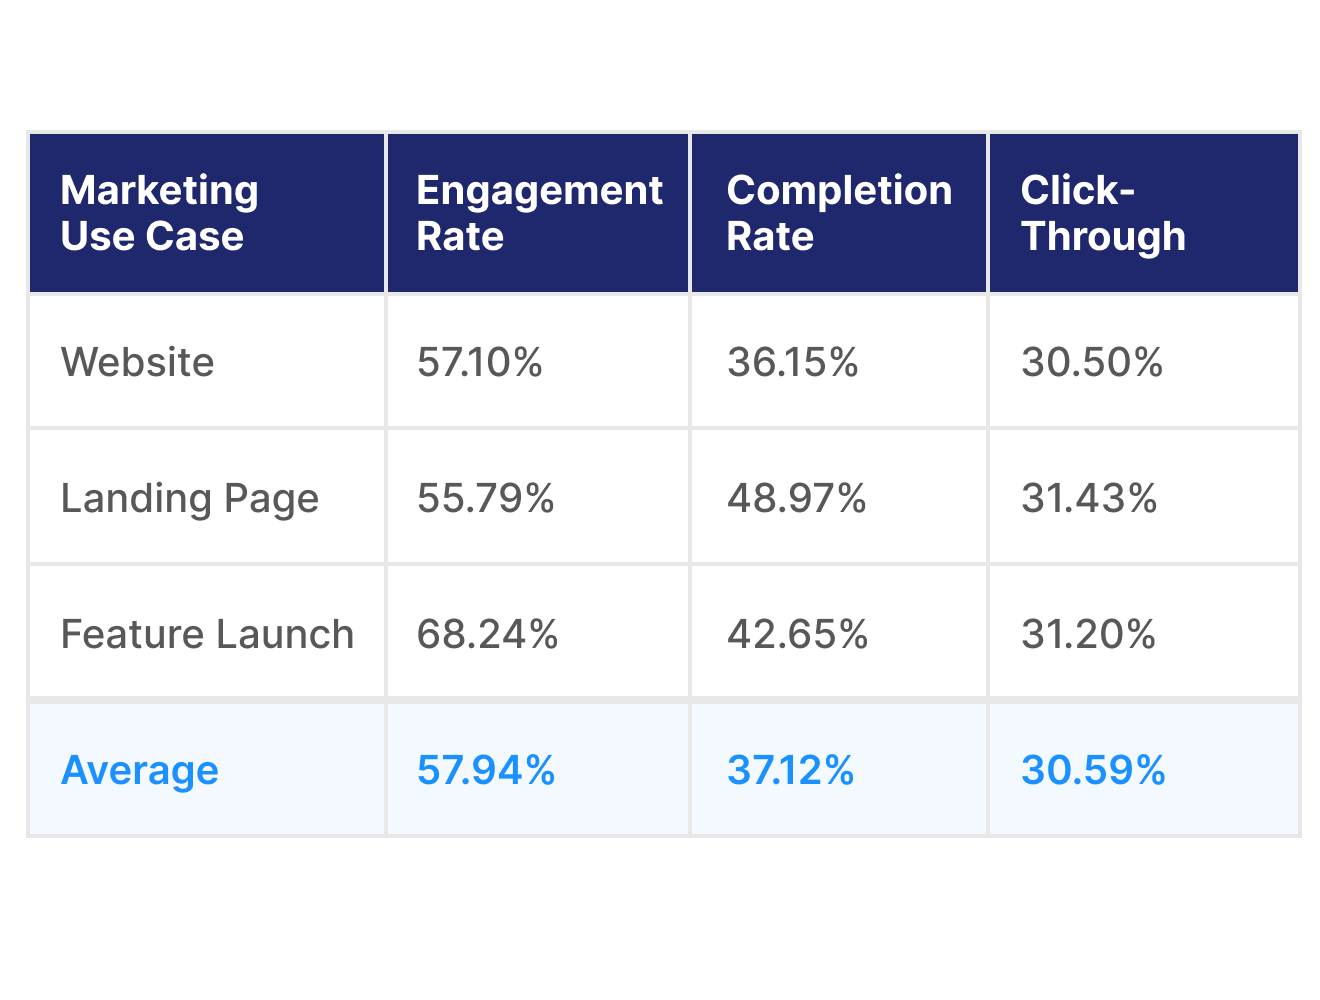
Below we look at those three categories and the most popular use cases for marketing, product, and sales.
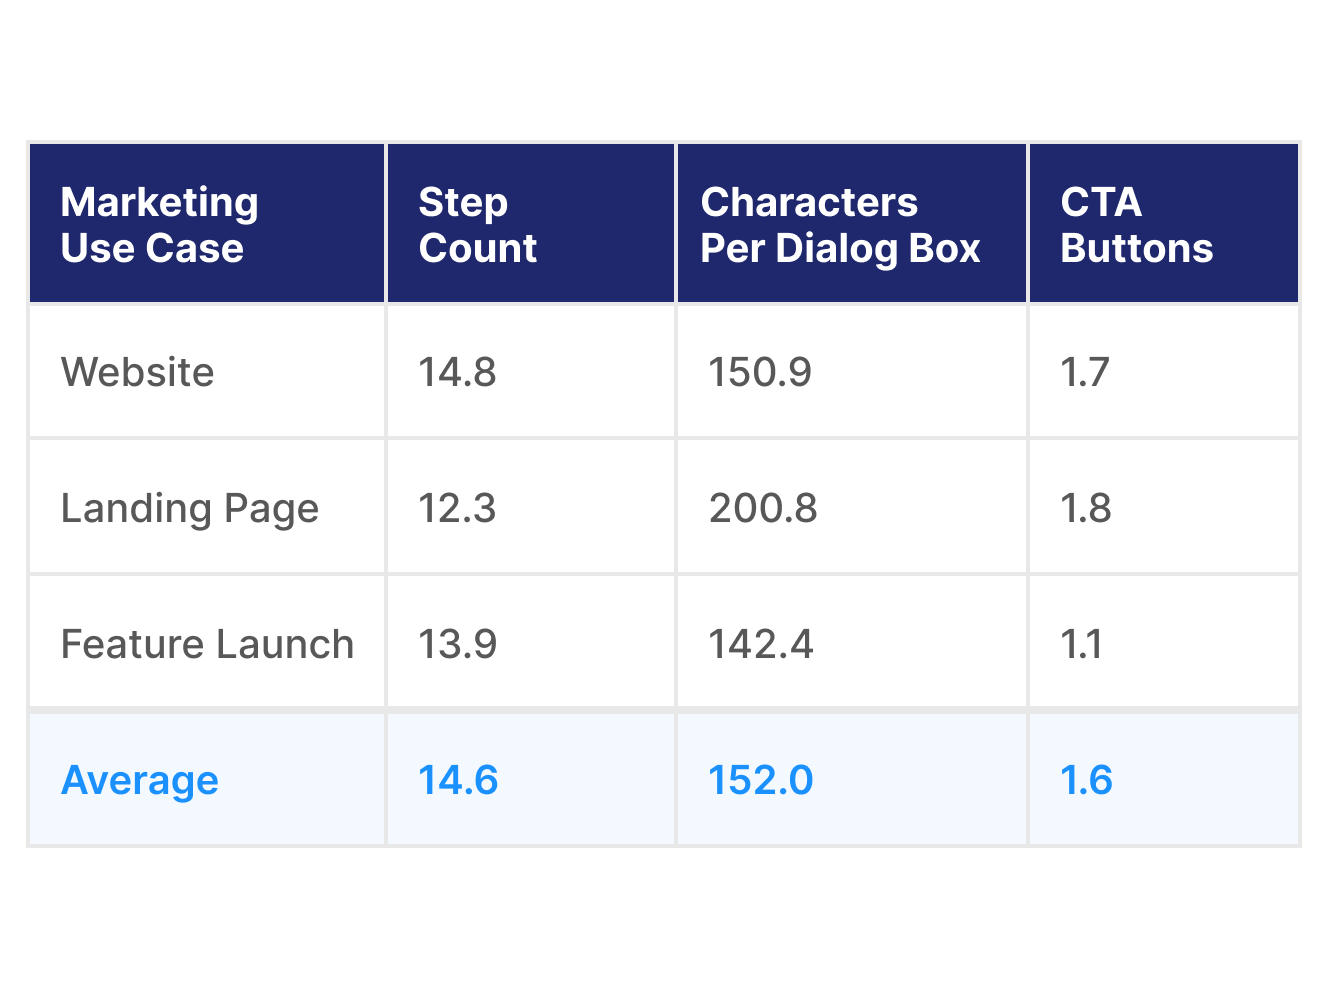
Interactive demos for the marketing use case
Interactive demos for the in-product or training use case
Interactive demos for the sales use case


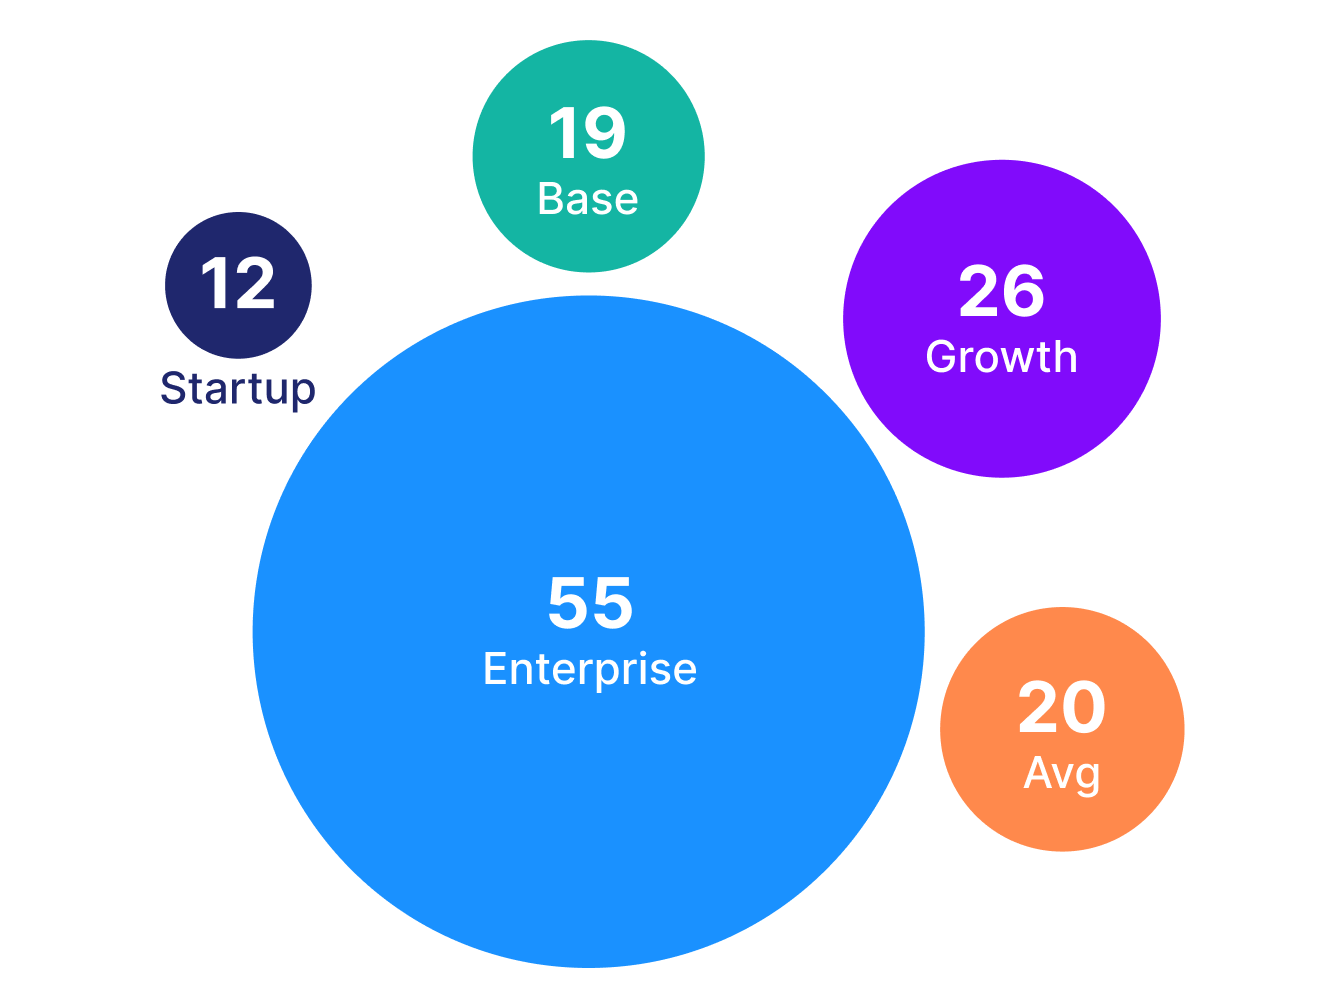
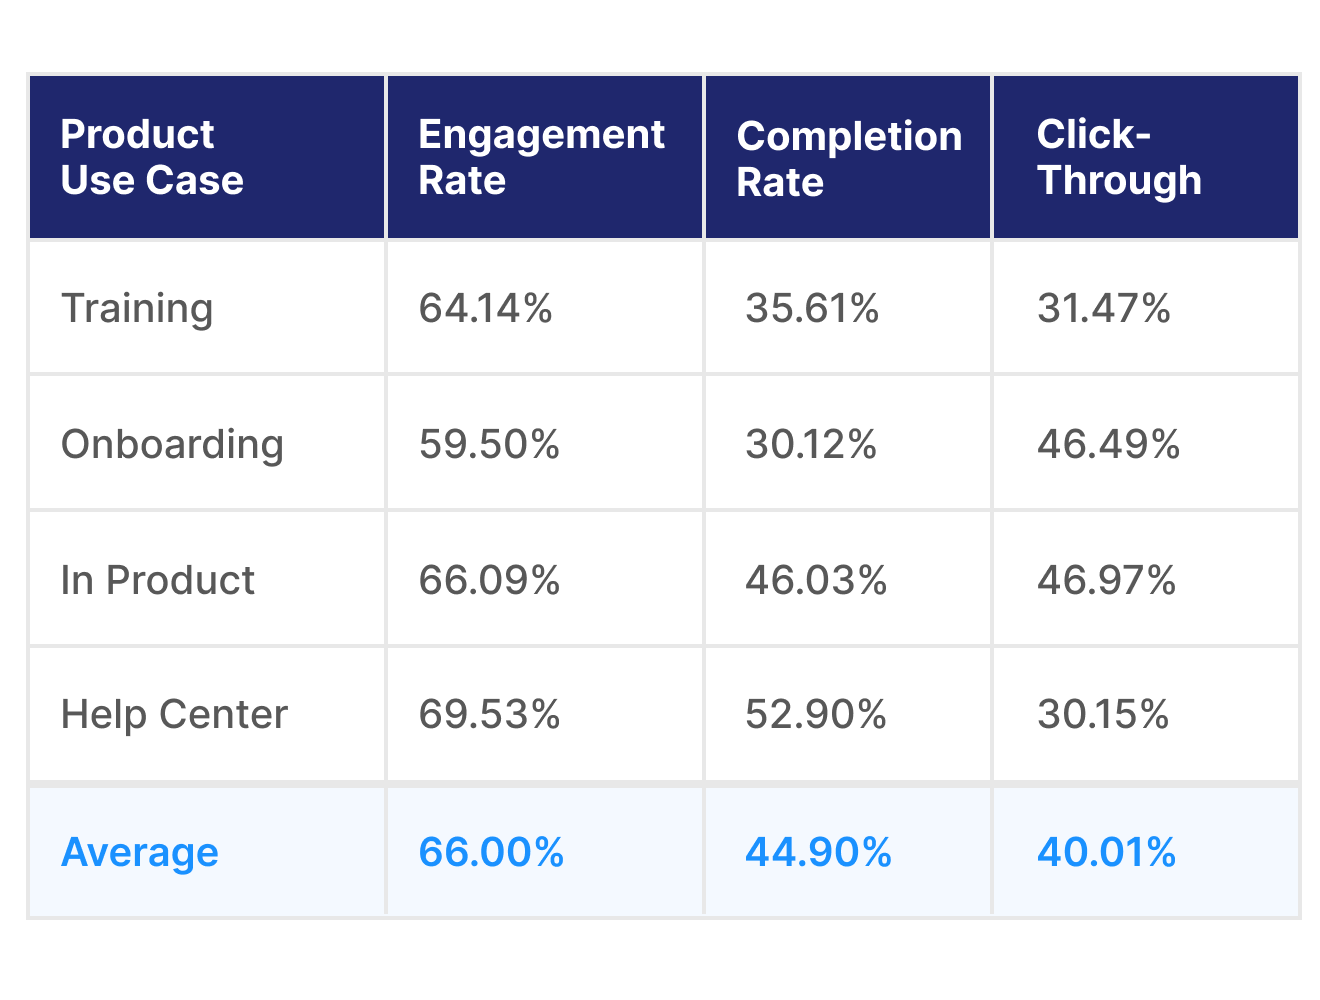
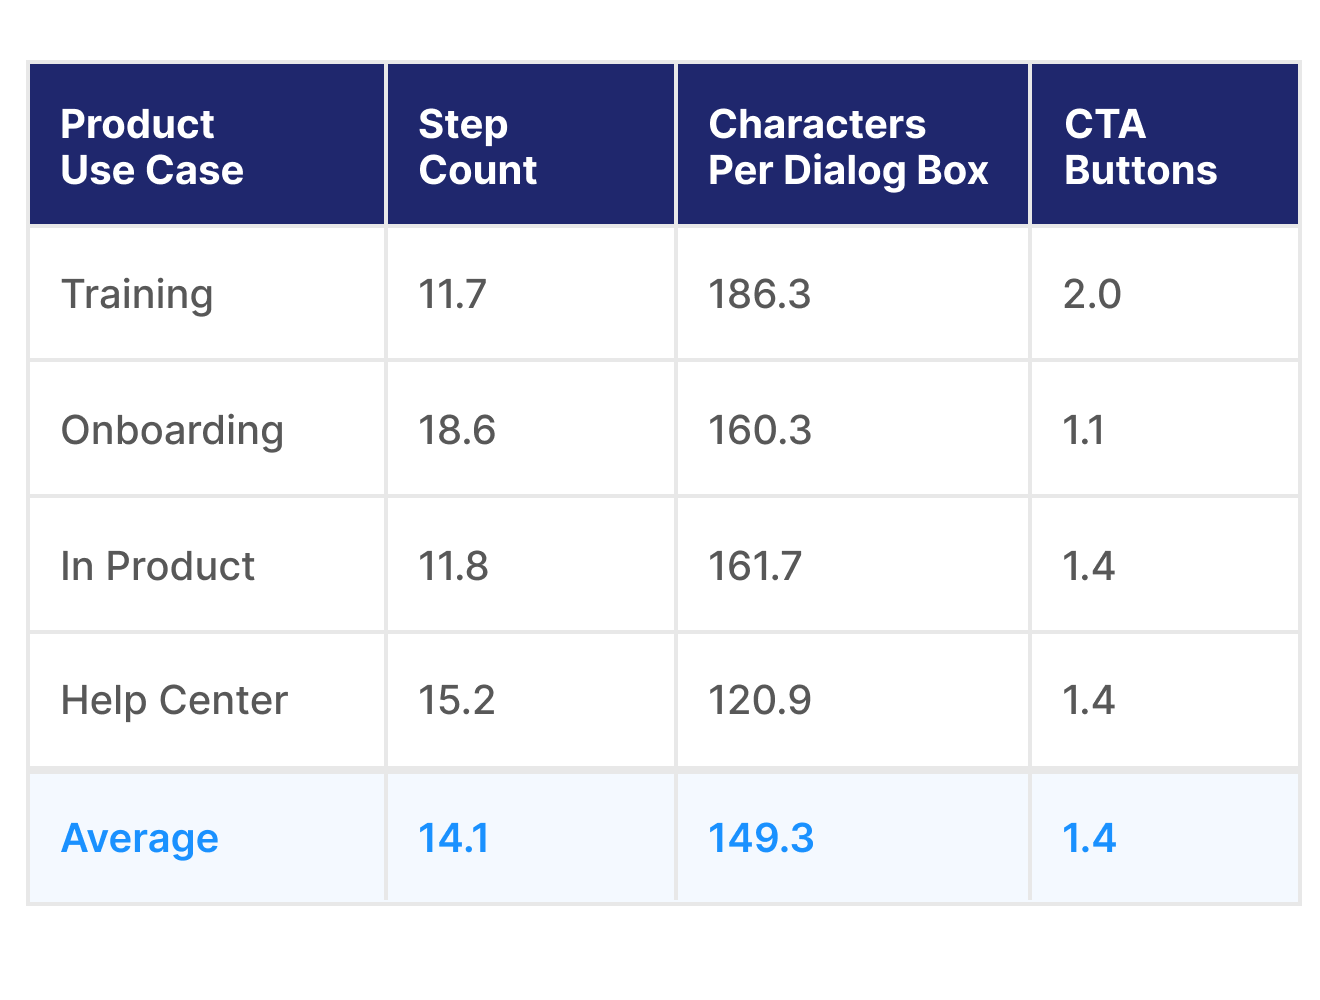
Demo Use Case Tips:
- The average Navattic customer creates 20 demos. Try experimenting with different use cases after you’ve nailed down your first use case.
- Tailor the step length and type of steps depending on what type of demo you are building. For example, an onboarding demo is on average 4 steps longer than a landing page demo.
How do I build successful interactive demos?
While the demo structure and content depends on the use case, by looking at the top 1% of interactive demos we found commonalities between all types of high-performing interactive demos.
Below we look at how top performing approach copy, in-demos CTAs, and gating.
Copy and content of high-performing interactive demos
Click through rates and CTA types for high-performing interactive demos


Gating vs ungating for high-performing interactive demos


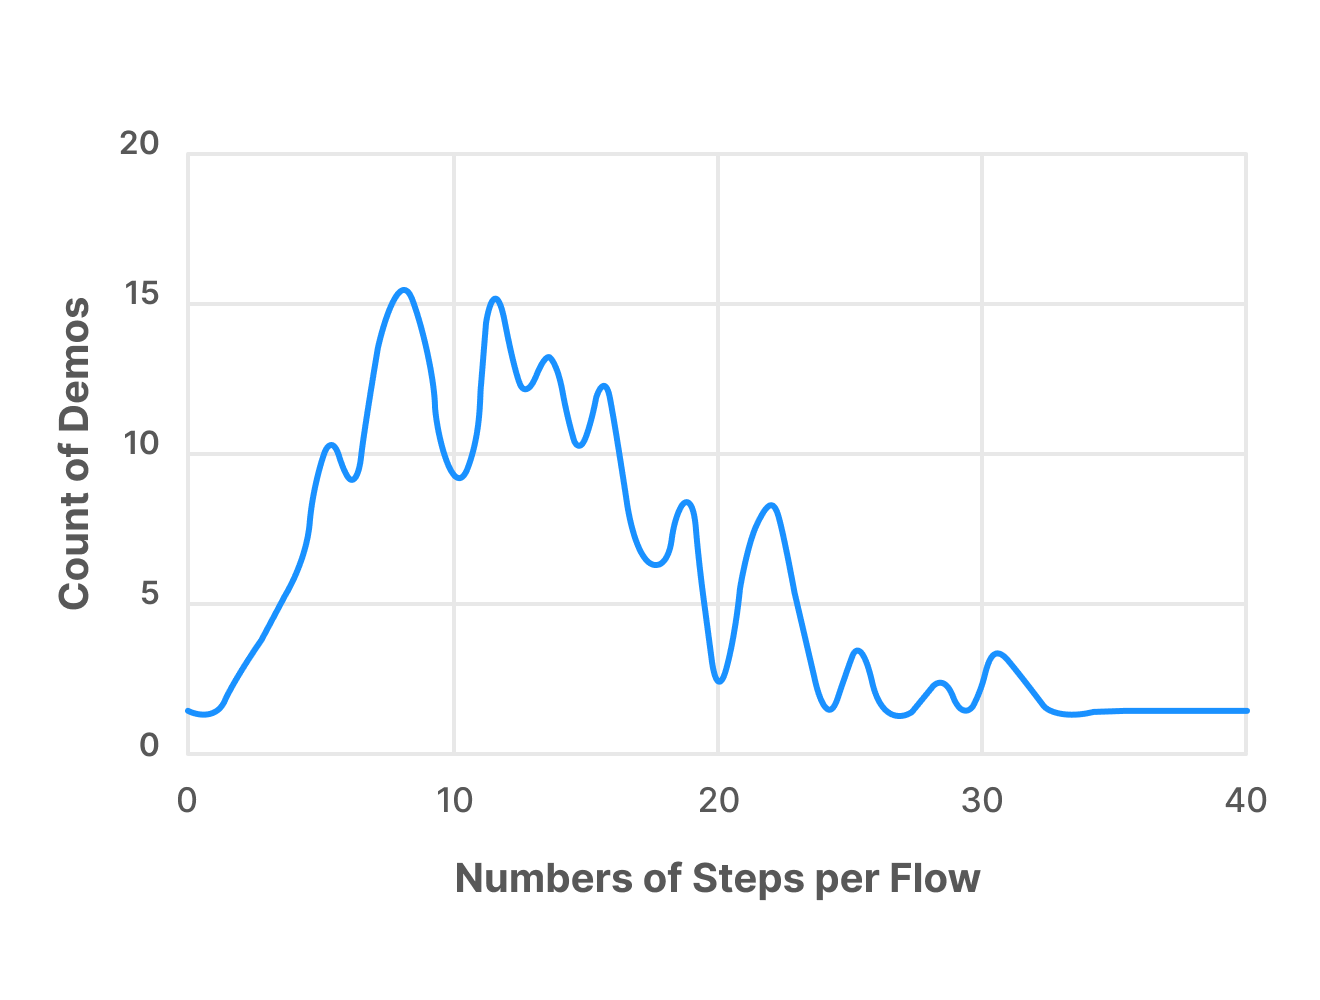
Demo building tips:
- Keep demos to about 15 steps and aim for about 30 words per step.
- Consider ungating your demo for higher completion, engagement and CTR rates. Instead of gating upfront, add a form later in the demo and/or multiple CTAs through your demo.
How can I promote my interactive demo?
Considering the most popular use case is for website interactive demos, this section looks at successful website deployment.
Below we look at how top-performing approach distribution methods, CTA copy, and demo placement.
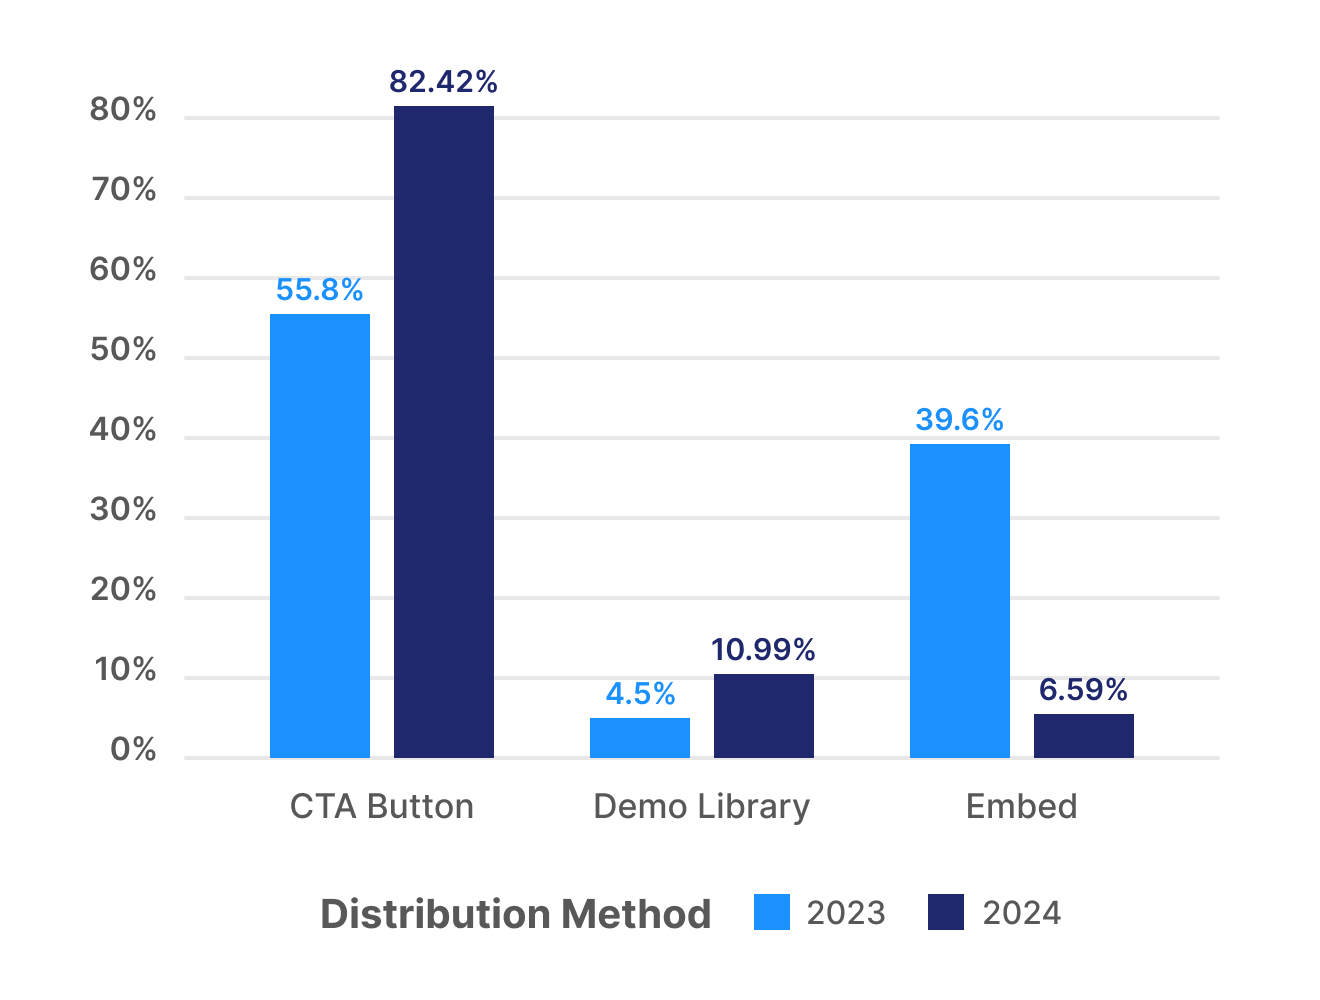
Website CTAs vs embed of high-performing interactive demo


Landing page placement of high-performing interactive demo
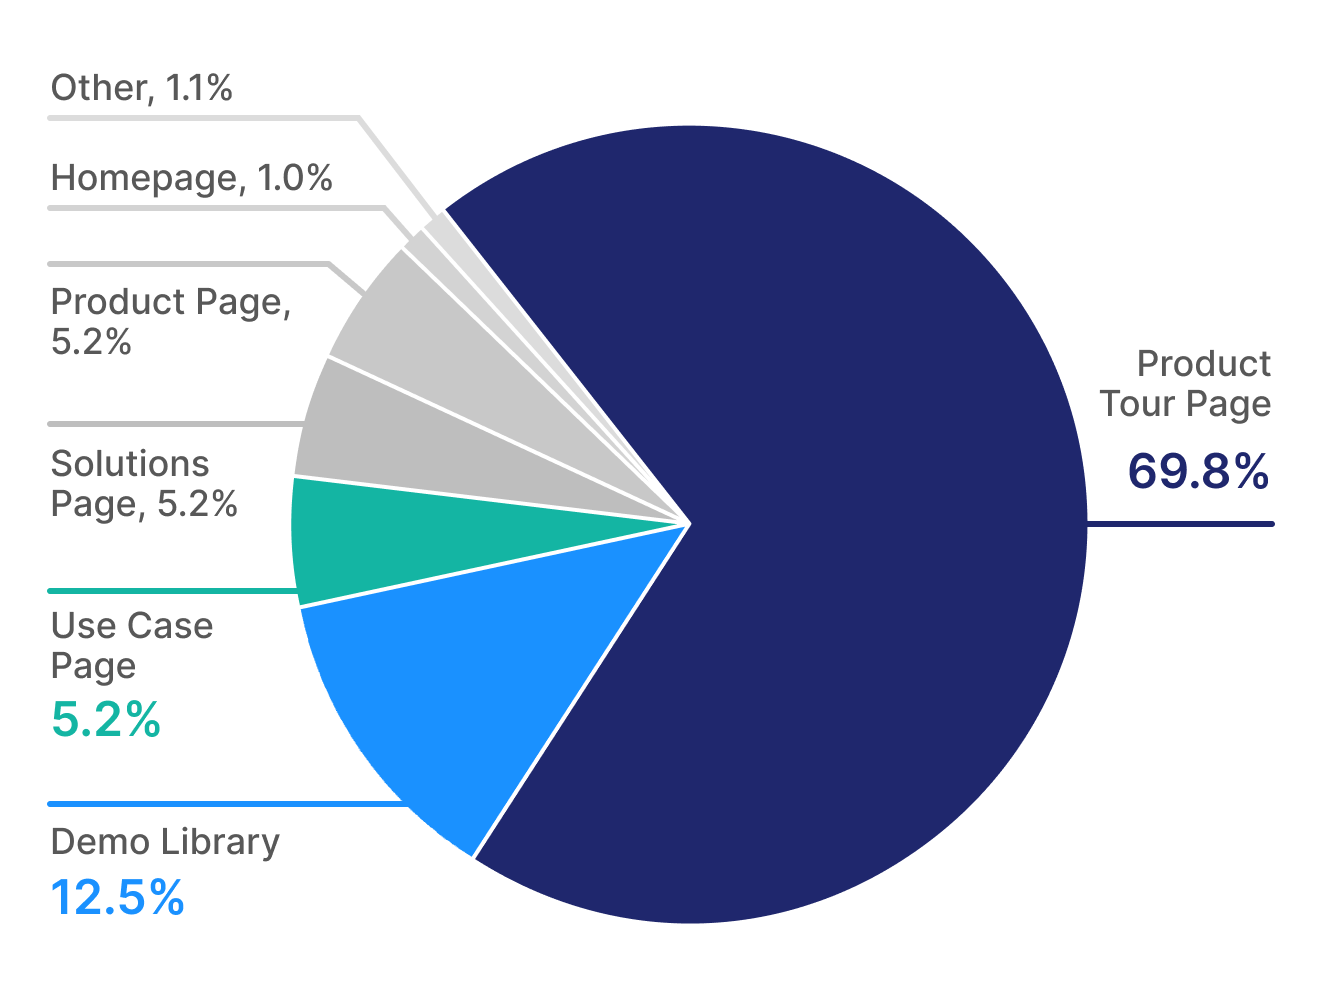
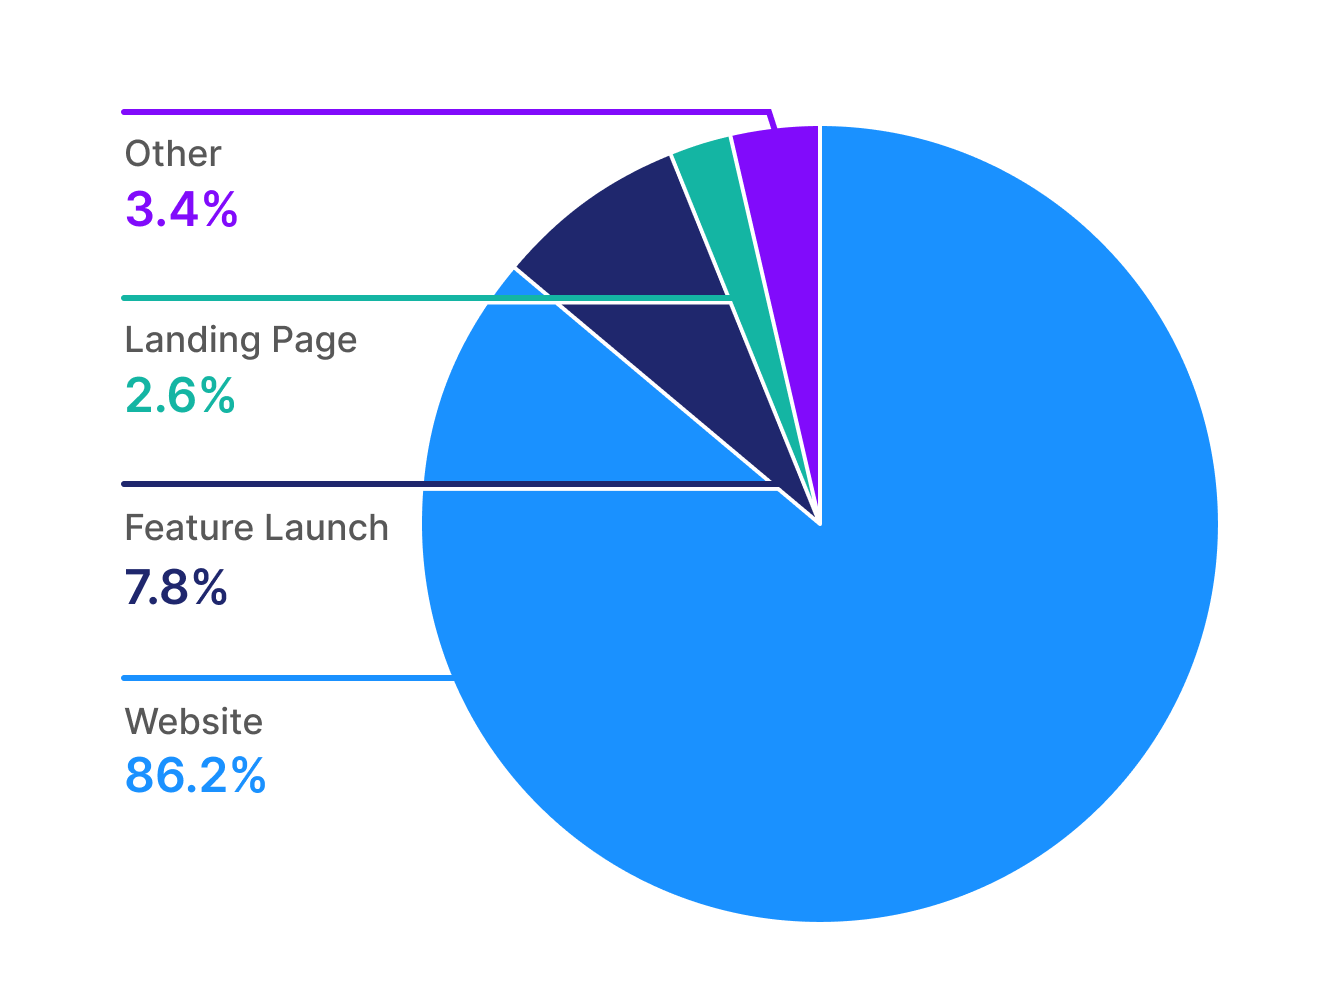
Below is a breakdown of where interactive demos are most frequently placed, both if they are linked out via a CTA or if they are embedded on a landing page.

Demo promoting tips:
- For the highest engagement place your interactive demo CTA above the fold or in the navbar.
- If you have a more complex product or sell to a wide variety of buyers, consider a demo library. Demos libraries let you show off all your functionality at once for different use cases, product lines, or personas.
What are the key takeaways?
Use Cases:
Interactive demos are being used for a wider variety of use cases and by a larger audience. The average number of demos built by Navattic customers was 2x compared to 2023's report (20 per customer compared to 9 per customer). Demos usage on websites has increased in popularity by almost 90% since 2022, for both PLG and Sales Led companies.
New common use cases included interactive demos for feature launches, interactive demos embedded within a product, and sales enablement.
Content:
The highest-performing interactive demos are concise, inviting, and personalized. Try to tell a story that explains why this product will be valuable to your audience, instead of what your product does.
To tell more personalized interactive demos by persona or use case, consider a demo library. Demo libraries increased in popularity by 2.7x compared to 2023.
Promotion:
Ungated interactive demo CTAs such as “Take a Tour” or “Start Demo” are the most popular ways to deploy interactive demos. Top-performing interactive demos had these CTAs placed in a prominent spot on the website, such as above the fold or a navbar.
If you do need to gate your demo, consider gating it after step 5 to increase engagement and completion rates.
Turn demos into deals.
Build interactive product demos that engage buyers and close deals faster.